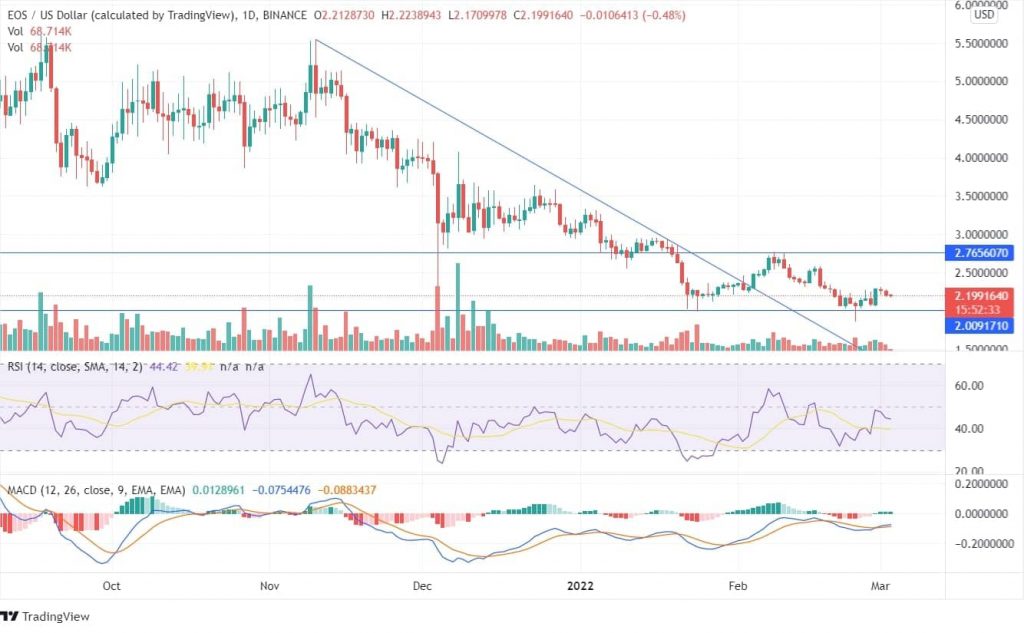
EOS was trading around $5.54 on November 10, after which the coin has been declining continuously and reached its support. The coin has been lucrative for the bears in the past three months; however, for the bulls, the coin had been rewarding in an intraday session. Until February 03, the coin was moving below the downtrend line; however, on February 04, the bulls tried to push the price up. The price of EOS couldn’t cross the high of $2.76 and began to decline back towards its support. On February 24, the price got tested at the support line of $2.02 but couldn’t close below it. In the past few days, the coin has been marked consolidation. Once the coin closes above the resistance of $2.76 or below its support of $2.02, durable price action in any of the directions may happen.
 The MACD indicator shows a buy sign. However, the bulls should wait for the price to close above the $2.31 for the trend confirmation. The RSI indicator at 45 currently reflects moderate momentum. There is an existence of bullish divergence between the price and the RSI indicator. However, for the confirmation of divergence, in the long run, the price should close above the peak of $2.76 as per EOS price prediction.
On the weekly chart, the coin shows a fall in the price from the last three weeks; however, the forming candle shows a rise in the price for the support line. Though the price closed outside the downtrend line, the bulls couldn’t push the price up above $2.76. The volume candles haven’t been favourable towards bears or bulls, thus creating indecision regarding the price movement in any of the directions.
The investors should wait for the forming candles and the price to close above or below the recent swing high of $2.31 or swing low of $1.85. However, if the price closes above $2.76, a robust bullish momentum can be expected in the long run as it will be confirmation of bullish divergence, and the price will be closing above the support zone.
